 Kapti
Internal project Banking
A cash flow forecast that SME owners understand and can correct
“Will I be able to pay salaries in six weeks?” A forecast with its margin of error, and categories the AI explains.
- Sector
- Banking
- Typical engagement
- 9 weeks
- Indicative budget
- From €49,500 excl. VAT
- Proposed team
- 4 leads from the collective
- Services
- AI Product Sprint · Express Design System
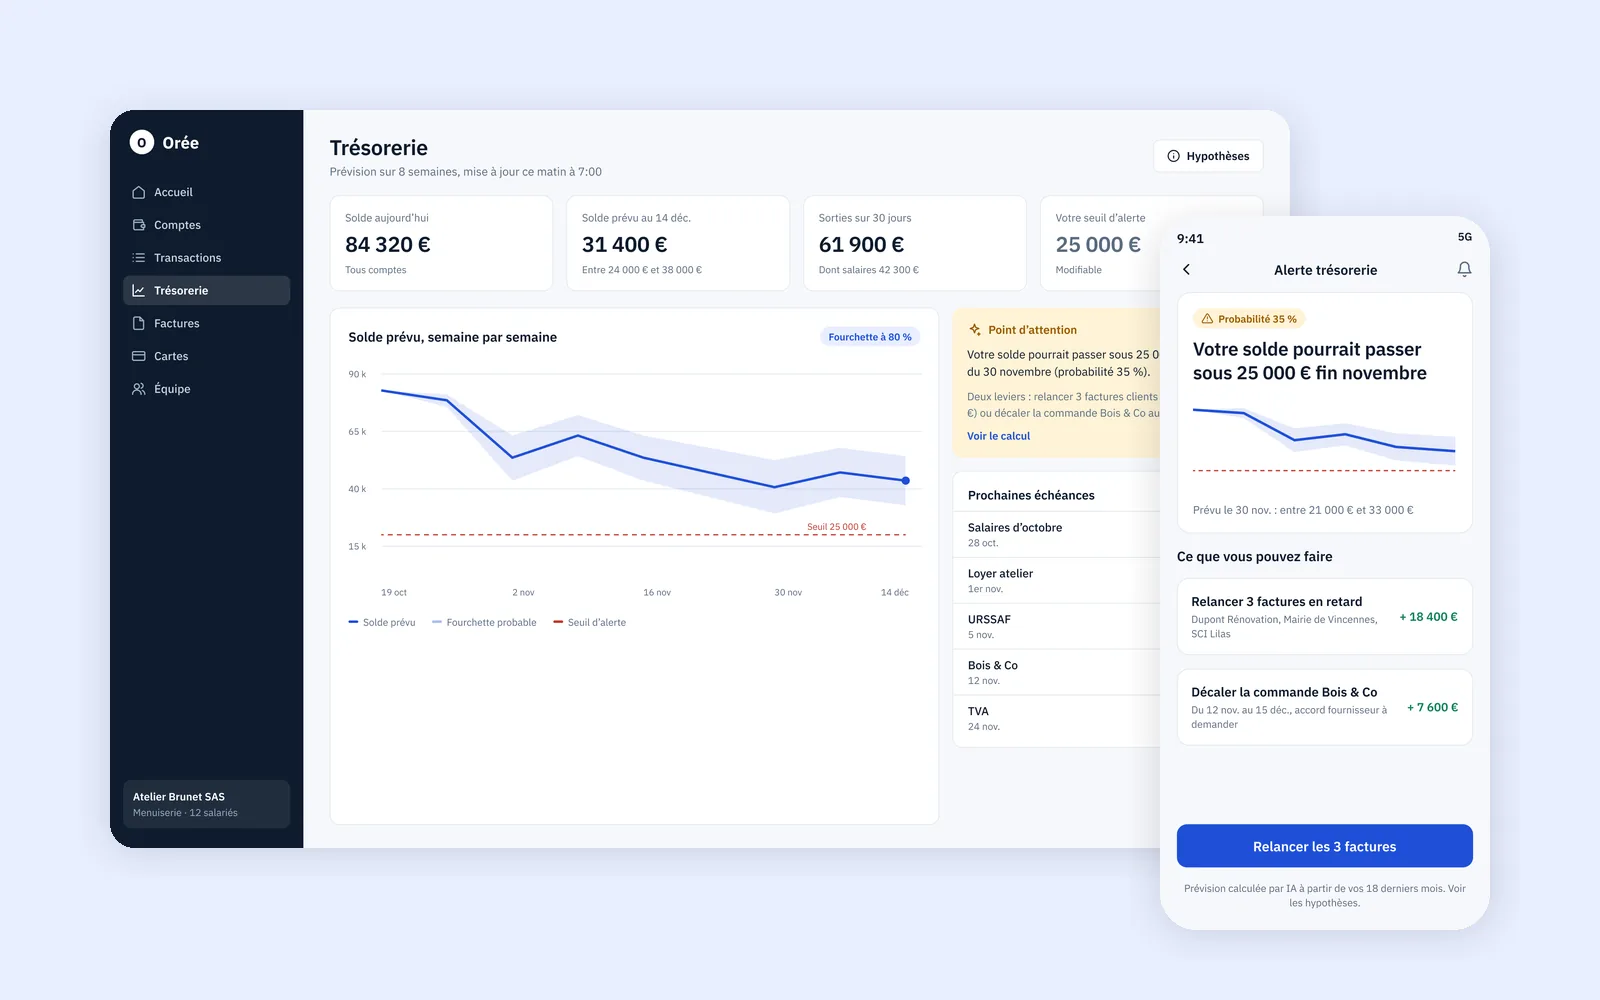
Internal project, carried out among members of the collective to explore the banking sector. This is not a client engagement: “Orée” is a demo brand.
Context
The need we imagined, based on what we hear in the sector:
Our customers mostly ask us one thing: whether they’ll be able to pay salaries in six weeks. Our automatic expense categorization gets it wrong about one time in five, and nobody understands why. Meanwhile, our web and mobile teams each have their own components.
Typical client: A neobank designed for freelancers and small businesses, whose customers manage their cash flow day to day.
The challenge
- 1
Trust before precision
A forecast shown with its range and assumptions inspires more trust than a single figure that turns out to be wrong.
- 2
Explain every category
For each transaction, the AI says why it chose a category. A correction applies to similar transactions.
- 3
A single visual language
Financial charts and components must be identical on web and mobile, and accessible.
The engagement we would run
Typical 9-week engagement
Here’s how we would run this engagement for a real client. The screens and demo below were produced during the internal project.
- 1
Research · Weeks 1 and 2
10 SME owners and 4 accountants interviewed, a cash flow diary kept for a week by 6 customers.
- 2
Design · Week 3
8-week forecast with a range, threshold alerts, a “Why this category?” panel and one-tap correction.
- 3
Development and testing · Week 4
Forecasting model on simulated account data and generated explanations, tested with 6 business owners.
- 4
Design system · Weeks 5 to 9
Tokens, 30 components including 12 financial charts, accessible, in Figma and React, adopted by the web and mobile teams.
The team we would bring in
4 leads, one role each

Vincent Pedemonte
Engagement lead

Thomas Thévenet
UI, data visualization and research

João Da Silva Marly
Front-end and design system lead

Meril Banzouzi
Back-end and AI development
The screens
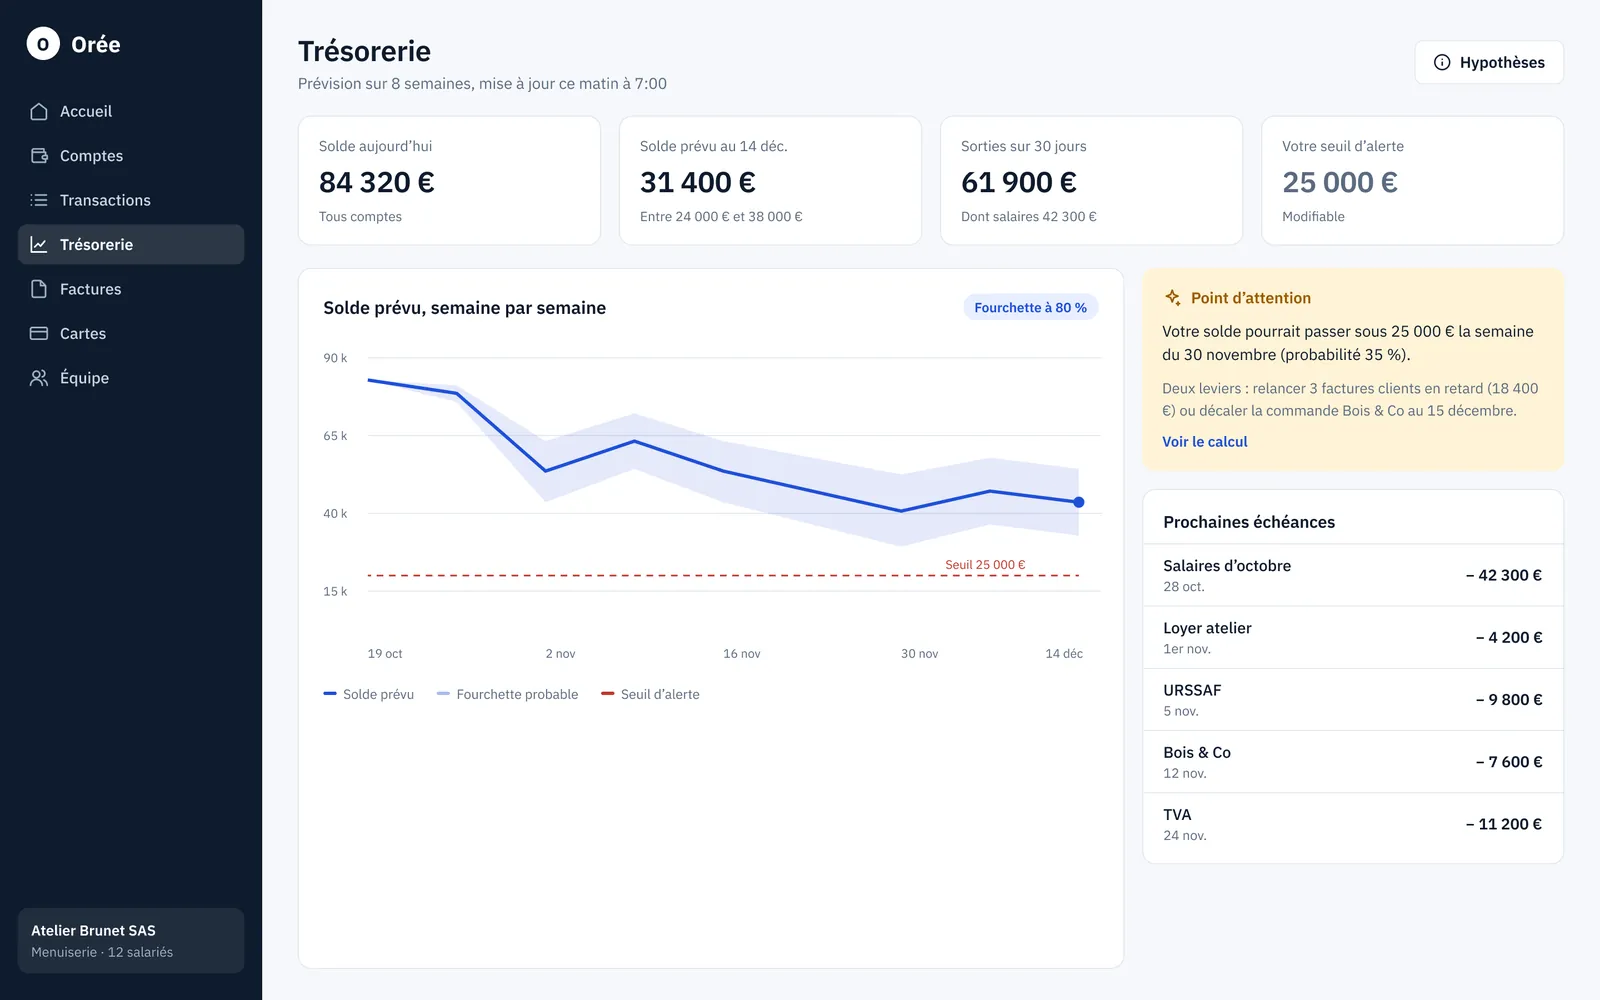
Cash flow dashboard. Forecast balance at 8 weeks with its range, upcoming payments, and an alert before the threshold set by the owner.
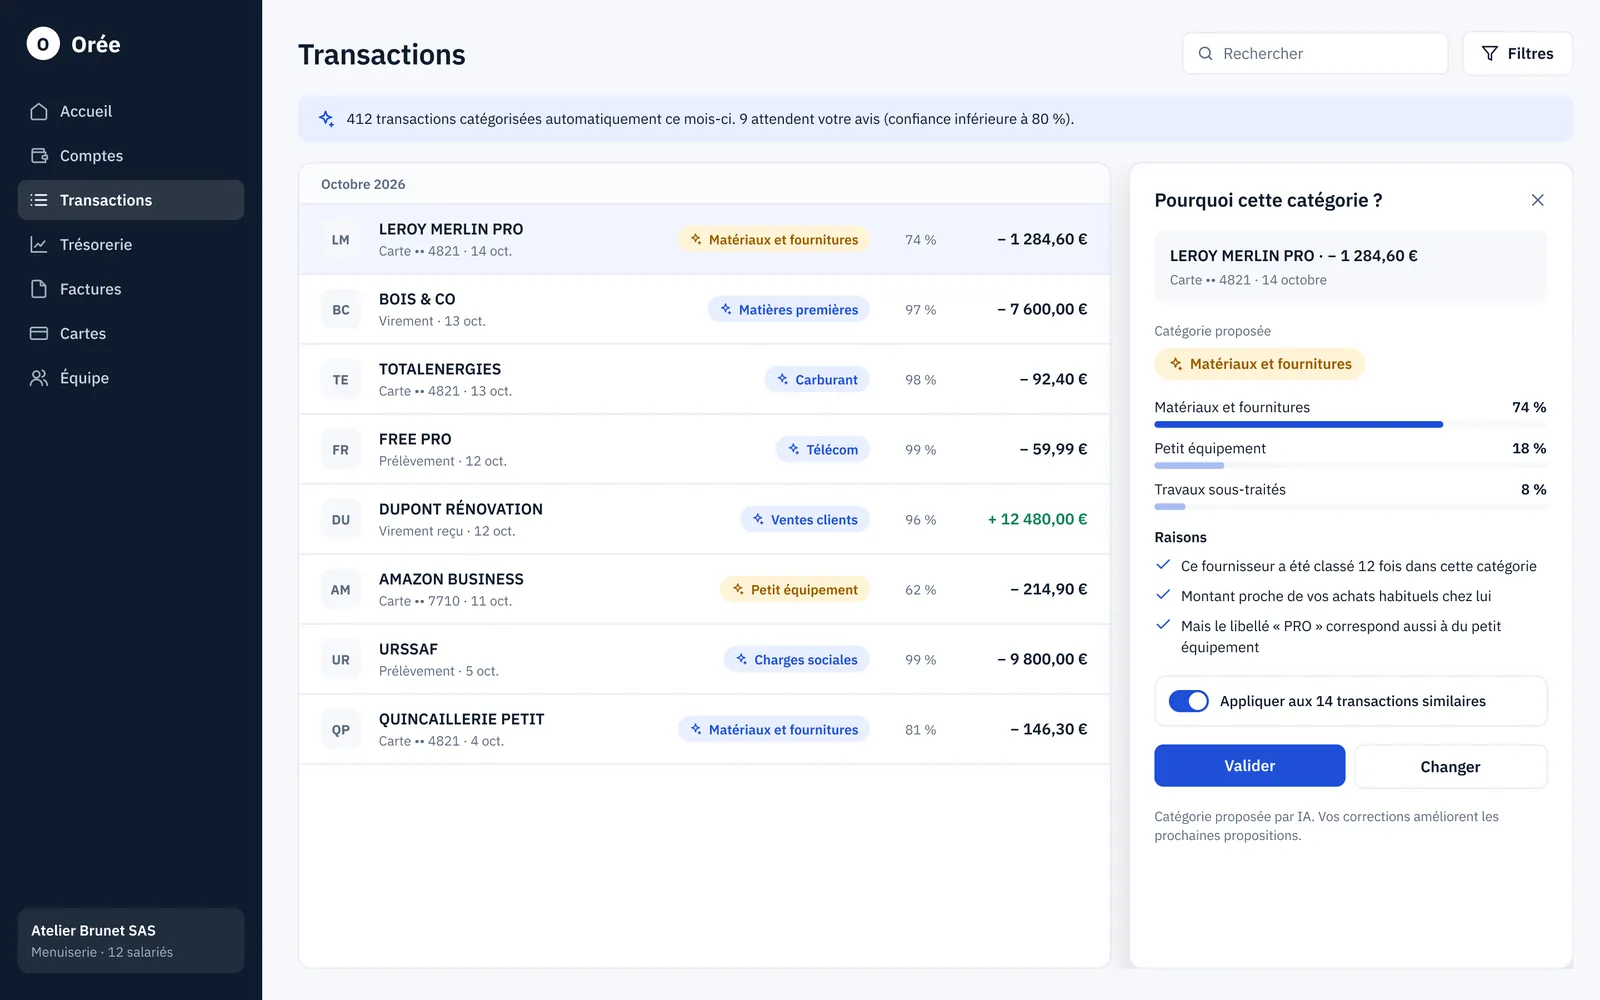
Transactions categorized and explained. Each suggested category shows its reason and confidence level. A correction can apply to similar transactions.
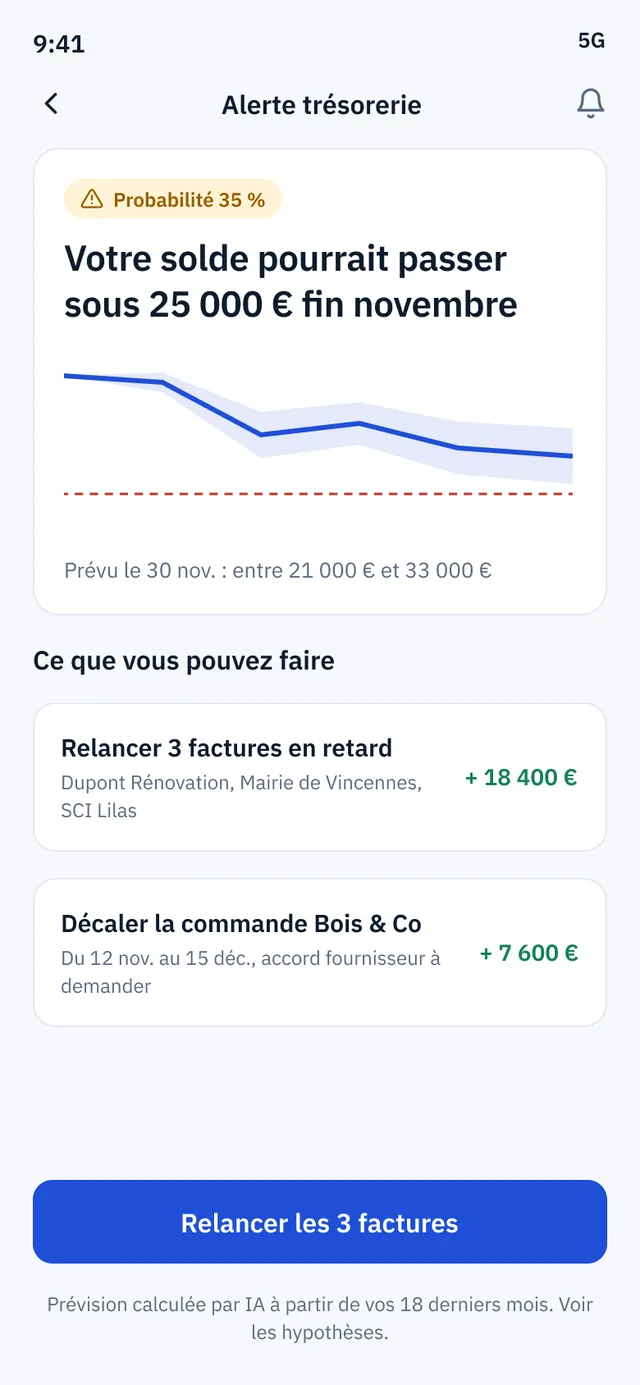
Mobile alert. A clear notification when the forecast balance drops below the threshold, with the two possible levers.
Interactive demo
You run an SME
Your expenses are categorized automatically. When a category is wrong, you correct it once and the tool takes it into account.
Your turn
- 1Change a transaction’s category
- 2Transactions from the same supplier follow
- 3Confidence and reason update
Correct a category
Demo data. Change a category: the correction can apply to similar transactions.
| Transaction | Category | Confidence | Reason |
|---|
Target outcomes
- Category corrections per customer · Target: halved within 3 months
- Weekly forecast views · Share of business owners active each week
- “Category” support tickets · Tracked before and after
What the client would receive
- Research summary and user journeys
- Web and mobile mockups
- Working version of the forecast and explanations
- Documented Figma and React design system
- Contribution guidelines